

Section Styles spotlight-header
I am an
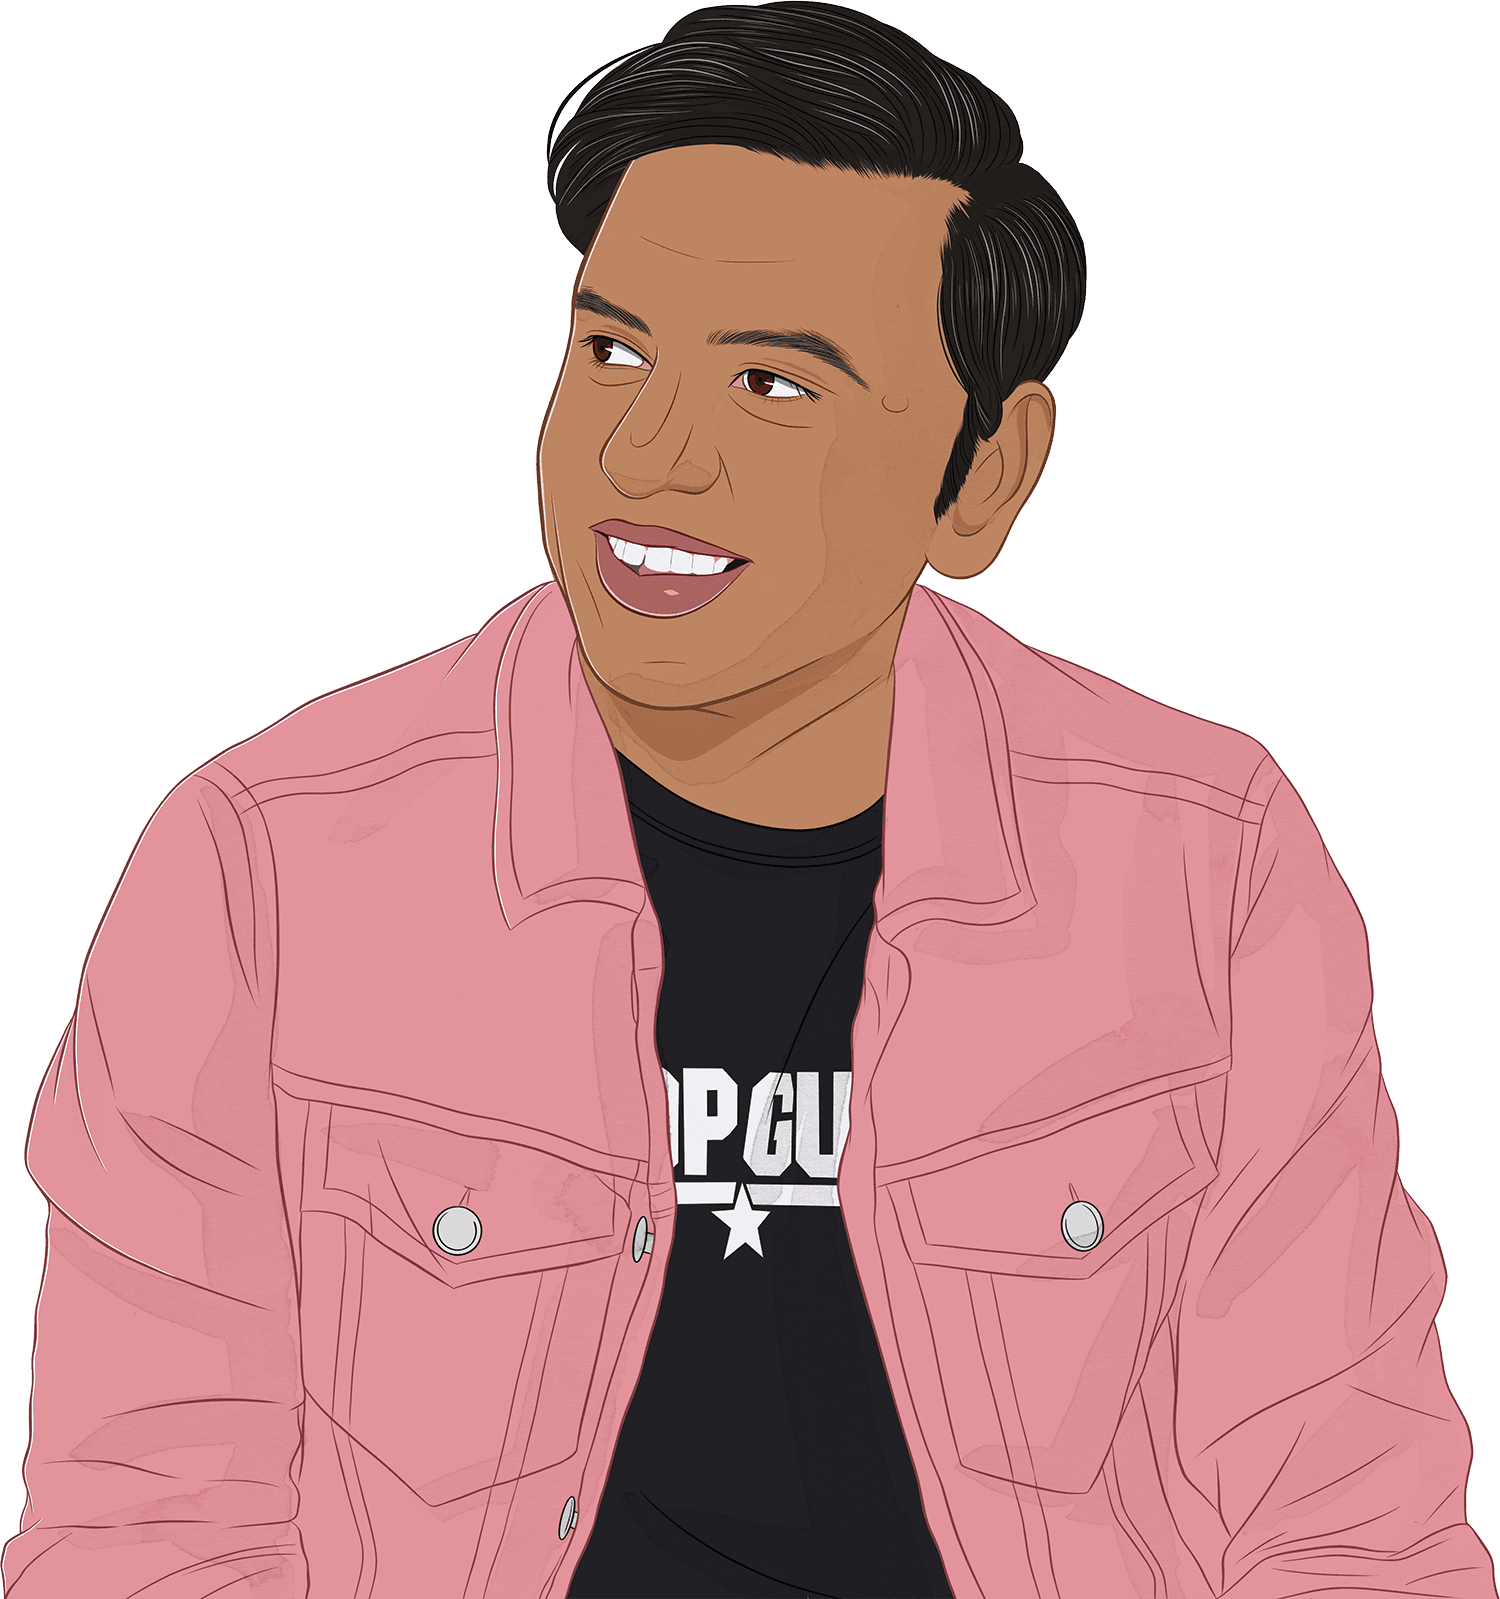
INFORMATION analyst
Dilip Merala
Presented by AMGEN FOUNDATION

COMPANIES often collect huge amounts of data.
As an Information Analyst, I find and tell the story behind all the data.

MY WORK SETTING


Indoor vs. Outdoor
I spend the majority of my time working inside at a desk or in meetings.

People vs. Alone
I spend a lot of time alone and also collaborating with others.

Creative vs. Defined
A lot of my work is creative, requiring me to develop new models and find ways to visualize data.

-
Clinical trials (which are experiments designed to test how well a new treatment works) can produce a lot of data. My job is to comb through all of that information, analyze it, and work with various departments to create engaging ways to communicate what I find. The goal is to identify insights that the company can use to inform and guide its choices. It’s as much about data science as it is about data storytelling. My work also involves how best to use AI to tell better stories with data.
-
I use a wide range of tools in my job, including Python and Spotfire. Depending on the needs of the project, I might use statistical tools or more complex machine learning models to understand what a particular dataset is telling us. In some cases, I may need to develop new tools that fit the goals of a project. It’s a lot of computer work, but I also collaborate with other team members across different departments to make sure I have all of the information that I need before drawing conclusions. Once I understand the data, I use data visualization techniques to figure out the best way to bring it to life so that others can easily understand what it’s telling us. It’s a very creative process.
-
Working in biotechnology, it’s very important that the treatments we produce and our approach to producing them are thoughtful and fair. Our leadership needs to know how we’re doing in order to keep improving. So, in addition to analyzing clinical trial results, I might look into questions like whether we’re properly representing different regions and diversity in our trials and what types of medical conditions are getting the most (and least) attention. The goal is to use data to help speed up the timeline for the development of certain drugs and to make sure we’re doing it responsibly. We have the potential to make an impact on real people’s lives, and that makes it all worth it.

My Work NeedsEssential Skills:
CREATIVITY
It takes a lot of creative thinking to find the story in the data, to determine the best way to answer questions, and to effectively communicate our findings to everyone.
ANALYTICAL SKILLS
Our data sets can be really big and complicated. You need a strong technical skill set to understand how to properly make sense of the data and structure the analysis.
CODING
Most of our work is completed using data analysis and visualization software. Reading and writing code make it possible.
TIME MANAGEMENT
Our work is fast-paced and it’s necessary for our teams to be updated regularly. I need to be able to manage many projects (and people) at once and work efficiently.
Days in the Life
Come along and explore what three days at my job might look like!
DAYS IN THE LIFE

How I Work
Check out what my workspace looks like on an average day.


This is what my workspace looks like!
Laptop & Monitors. My job is computer-heavy, so a great computer is essential.
Speaker. With as many meetings as we host virtually these days, it’s important to have great speakers.
Camera. Many of our meetings take place on Zoom, so I keep a good camera around.
Reference Guides. I’ve got a few go-to books around, like Introduction to Machine Learning.
Coffee. Always on-hand for a boost of energy.

Did you know...There’s more than one way to look at the same data.
‘Imagine you’re looking at a field with hundreds of birds. Most of them are white swans, but there are also a few flamingos, ostriches, peacocks, and a single penguin. When asked to report what you saw, you have a lot of options. You could say, “almost all of the birds were white” or “it was a colorful variety.” You could say, “it seemed primarily home to long-necked birds.” or “only one of the birds had a short neck.” What you choose to focus on might change how people think about what kind of birds live in the field and what’s important about them. All data sets are like that – varying slightly when viewed through different lenses, revealing different insights and interpretations depending on how you look at it. Data aren’t just numbers on a page; they’re the raw ingredients of countless possible stories, all of which might, technically, be true. Also, fun fact: the word “data” is actually plural!
Which story you get depends on the questions you ask, how you choose to sift through it, and the angles from which you choose to view it. One analyst might look at a dataset with the goal of uncovering a trend that points towards a future prediction. Another might dissect the same data and find correlations that tell a story of past behaviors. Another might be focused on outliers or unexpected findings or, in worst-case scenarios, omitting the parts of the data that they don’t like. This possible range of interpretations speaks to both the versatility of data and its complexity. It underscores the importance of having skilled individuals who can navigate data responsibly - equipped with a keen awareness of how their methods and biases might color the interpretation of data.
At its heart, data analysis can be a creative effort, blending technical prowess with the creative storytelling needed to bring data to life. The best data analysts are not just number crunchers; they are adept storytellers who know how to weave a narrative that makes the invisible visible while staying true to the nature of the data. They understand that behind every data point lies something real, a fragment of a larger story. By treating data thoughtfully and carefully and understanding how our choices shape it, we can unlock hidden insights.’
Rewarding
These are the parts of my job I find particularly rewarding.

Spending a lot of time learning and developing code-based tools and processes.
Being one small part of a large company where everyone plays a role in getting medicine to patients in need.
But everyone is different! Drag the circles to place them where you rate them.
Challenging
These are the parts of my job I find particularly challenging.
Working with a variety of people and teams with different working styles.
Embracing that no two days are alike, thinking on your feet, and being ready to tackle unexpected challenges when they pop up.
Section Styles movable
These are the people I work with:

Leadership
We work with leaders at the company to make sure they understand our reports and takeaways to help inform their decision making.

Data Science Engineers
Different data science engineers work on different parts of each project. Some might be working on the automation team, or on the process team, but we all collaborate to bring the pieces together.

Third Party Developers
People often specialize in specific aspects of software development, so we have collaborators that might take on particular pieces of our efforts.
WHAT’S NEXT?
What’s next for my field of work?One of the most exciting things about working in STEM is how fast things change. Things that aren't possible today could be possible tomorrow.
AI could make data analysis a lot more exciting.
In the next 10 years, AI (artificial intelligence) could change how we look at data. AI has the potential to do more of the routine work, like cleaning up data and running simple tests to identify patterns and fundamentals. This means people who analyze data will get to spend more time thinking creatively and solving bigger problems. When AI is trained to handle the basics, analysts can focus on the really interesting parts of data, like finding new ways to understand or use it. Best case scenario, it could be like having a smart robot assistant that does the boring stuff, so we can concentrate on the most exciting work.
Looking for teacher resources?
PHOTOGRAPHER: Tandem Photo • Illustrator: Stephanie Singleton© 2024 THE PLENARY, CO. ALL RIGHTS RESERVED. TERMS. PRIVACY.This is a brand new site! See an issue? Let us know.